Hello, dear readers! Last time (which was more than a month ago, geez...) we talked about the most basic hierarchy layouts of D3.js: the tree and the cluster. Today, we're going to up the complexity just a little bit and look over three other hierarchy layouts: the treemap, the partition and the pack.
Warning: the post contains large images!
The three layouts, just like the last time, are very similar. They implement the idea of having values associated with the leaves of an hierarchy, and displaying the elements according to said notion of value.
In order to test it, let's update our data a pinch:
{
  "t": "0",
  "children": [
    {
      "t": "00",
      "value": 2
    },
    {
      "t": "01",
      "children": [
        {
          "t": "010",
          "value": 1
        },
        {
          "t": "011",
          "value": 1
        },
        {
          "t": "012",
          "value": 1
        },
        {
          "t": "013",
          "value": 1
        }
      ]
    },
    {
      "t": "02",
      "children": [
        {
          "t": "020",
          "value": 2
        },
        {
          "t": "021",
          "value": 1
        },
        {
          "t": "022",
          "value": 1
        },
        {
          "t": "023",
          "value": 1
        },
        {
          "t": "024",
          "value": 1
        },
        {
          "t": "025",
          "value": 2
        }
      ]
    },
    {
      "t": "03",
      "children": [
        {
          "t": "030",
          "value": 2
        },
        {
          "t": "031",
          "value": 2
        },
        {
          "t": "032",
          "value": 2
        },
        {
          "t": "033",
          "value": 2
        }
      ]
    },
    {
      "t": "04",
      "value": 5
    }
  ]
}
In case you missed it (I don't blame you), we added the value attribute to
each of the leaves of our data tree. Now, it's not particularly required
(since we can use the value method to set the value accessor), but for the
sake of learning we can save a couple lines in our JavaScript.
I've altered the HTML a bit so we can see all three layouts in action at once:
<html>
    <head>
        <script src="http://d3js.org/d3.v3.min.js" charset="utf-8"></script>
        <script src="http://cdnjs.cloudflare.com/ajax/libs/Colors.js/1.2.3/colors.min.js"></script>
    </head>
    <body>
        <div id='treemap'></div>
        <script src="02-treemap.js"></script>
        <div id='partition'></div>
        <script src="02-partition.js"></script>
        <svg></svg>
        <script src="02-pack.js"></script>
        <script type="text/javascript">
        treemap();
        partition();
        pack();
        </script>
    </body>
</html>
Note: I'm using the Colors.js library just
because I wanted the pics look pretty was too lazy calculating the colors
myself.
Note 2: I wrapped all the d3 code in functions. The reason for that were some variable scoping problems I encountered, which should not be the case for anyone not trying to bundle several pieces of code that were better as stand-alone scripts in one HTML. You can safely disregard the function wrappers from now on.
Now, the interesting part. The JS code is, again, extremely similar in all three cases, except for some peculiar properties here and there.
Let's start with the treemap. The idea behind the treemap is having all the data drawn in nested geometrical shapes which area is proportionate to the value. By default, it draws nifty rectangles, but again, you can use various projections to get different effects.
function treemap(){
    var width = 1000;
    var height = 1000;
    var margin = 5;

    var div = d3.select('#treemap').style('width', width)
                .style('height', height).style('position', 'relative');
    var treeMap = d3.layout.treemap().size([width, height]);

    d3.json('data.json', function(error, data){
        var nodes = treeMap.nodes(data);
        div.selectAll('.node').data(nodes).enter()
           .append('div')
           .style('position', 'absolute')
           .style('left', function(d){return d.x + margin * d.depth})
           .style('top', function(d){return d.y + margin * d.depth})
           .style('width', function(d) { return d.dx - 2 * margin * d.depth } )
           .style('height', function(d) { return d.dy - 2 * margin * d.depth } )
           .style('background-color', function(d) {
               return $c.rgb2hex(200, 200, 200 - 50 * d.depth)
           })
           .style('border', '1px solid black')
           .text(function(d) { return d.t; });
    });
}
Reminding you of something? Yeah, it's almost the same as our tree/cluster example, save for a few things:
- We no longer render the links. You can do it, technically (the treemap layout
has a
linksmethod), but I can't fathom the reason to do so. - We use absolute-positioned divs instead of SVG elements. The reason was, I wanted to show that D3.js isn't all about SVG. You can totally use the SVG elements though!
- I added margins for the elements for better visibility.
This code will generate us this image:
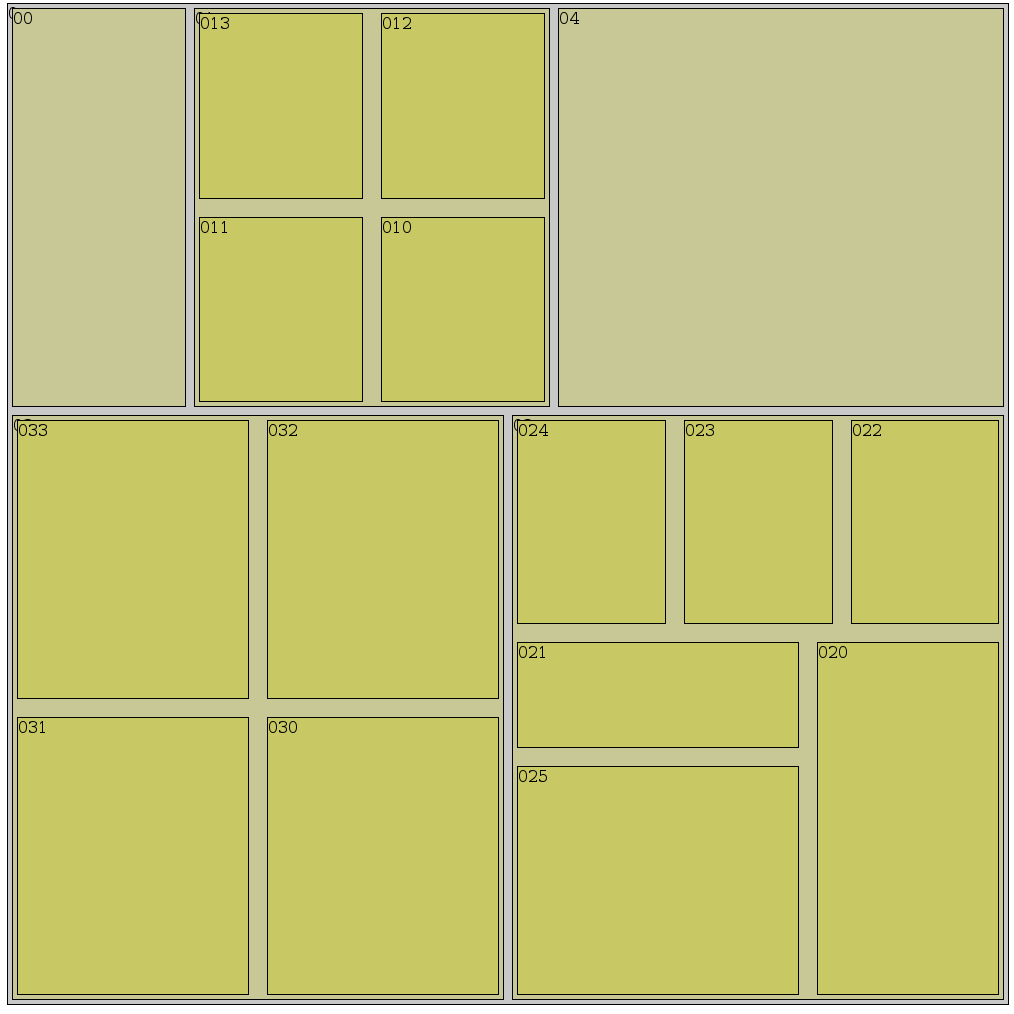
As you can see, the bigger elements' text peeks out from behind the smaller elements in the margins, which proves that, indeed, our tree was rendered in all its glory.
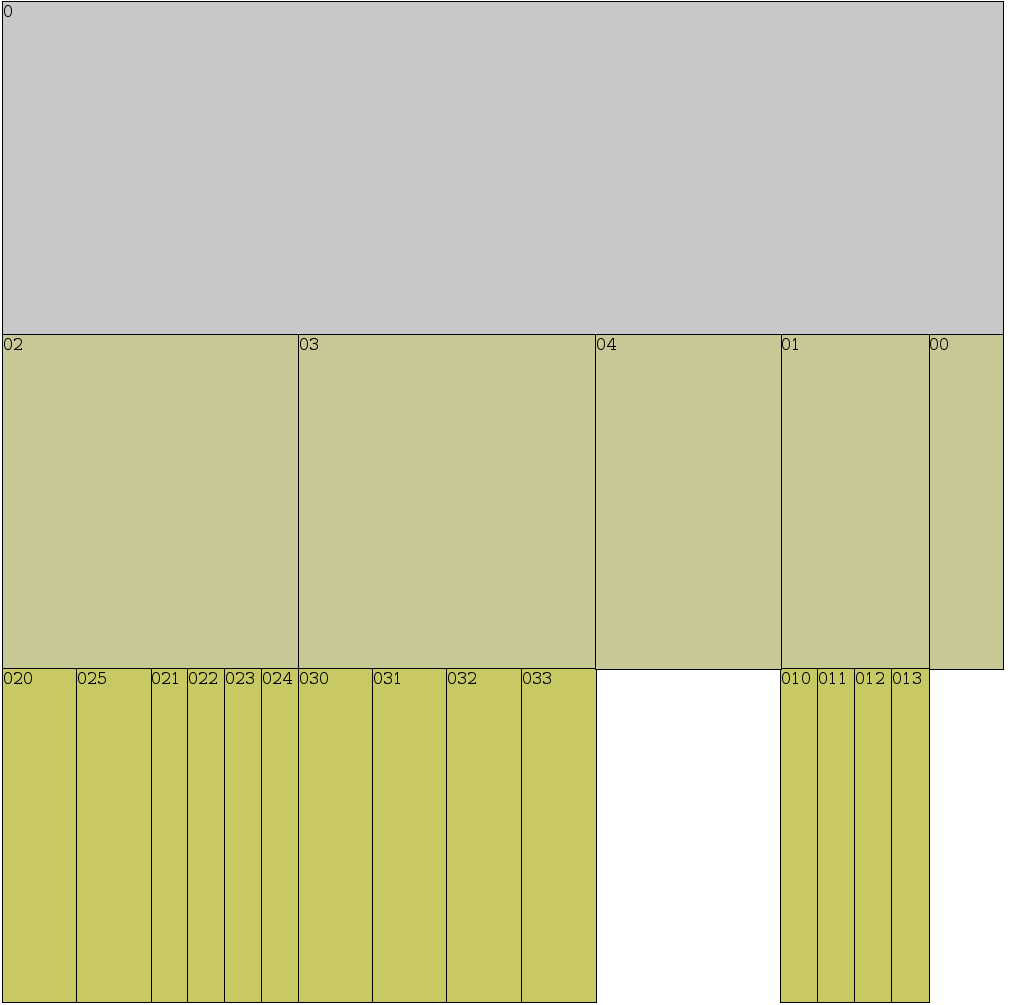
Next up is partition. It's quite similar to treemap, except the elements are not nested but flattened, with vertical hierarchy. By default it generates rectangles, but you can use projections to create various other shapes, such as sunbursts. The code is quite simple to the one used for treemap.
function partition() {
    var width = 1000;
    var height = 1000;

    var div = d3.select('#partition').style('width', width)
                .style('height', height).style('position', 'relative');
    var partition = d3.layout.partition().size([width, height]);

    d3.json('data.json', function(error, data){
        var nodes = partition.nodes(data);
        div.selectAll('.node').data(nodes).enter()
           .append('div')
           .style('position', 'absolute')
           .style('left', function(d){return d.x})
           .style('top', function(d){return d.y })
           .style('width', function(d) { return d.dx } )
           .style('height', function(d) { return d.dy } )
           .style('background-color', function(d) {
               return $c.rgb2hex(200, 200, 200 - 50 * d.depth)
           })
           .style('border', '1px solid black')
           .text(function(d) { return d.t; });
    });
}
The only thing different is the lack of margin, because the partition layout looks nicer without it.
Here's the result:
Finally, the pack layout is about representing data in nested circles (I think you can probably do it with non-circular shapes, but I can hardly fathom someone doing this) with the leaves' area proportionate to its value. Note that because of the circular shape of each node, the area of a non-leaf node doesn't strictly represent its value.
I had to use SVG in this example simply because I don't know if you can render a circle using HTML.
function pack() {
    var width = 1000;
    var height = 1000;

    var svg = d3.select('svg')
                .attr('width', width).attr('height', height);
    var pack = d3.layout.pack().size([width, height]);

    d3.json('data.json', function(error, data){
        var nodes = pack.nodes(data);
        svg.selectAll('circle').data(nodes).enter().append('circle')
           .attr('cx', function(d) { return d.x })
           .attr('cy', function(d) { return d.y })
           .attr('r', function(d) { return d.r } )
           .attr('stroke', 'black')
           .attr('stroke-width', '1')
           .attr('fill', function(d) {
               return $c.rgb2hex(200, 200, 200 - 50 * d.depth)
           });
    });
}
Which will generate us the following result:
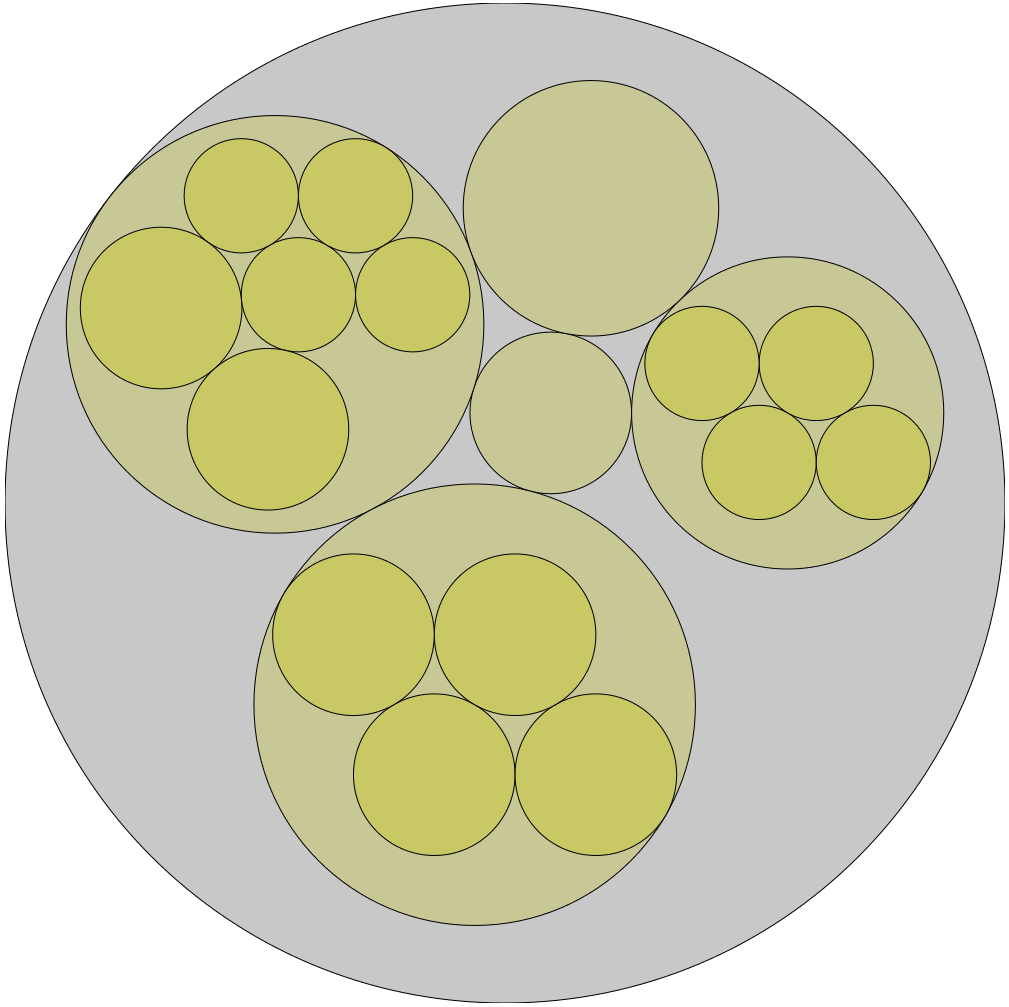
I apologise for not having the circles labeled, but I didn't want to make the example more complicated. If you want to look at the labeled circles, I recommend to look into the official example.
And that seems to be all folks! I hope you liked this tutorial and I hope to give you another one soon. Well, sooner than in a month. See the source code on GitHub.
Please comment and circulate the links! Thank you very much and I'll see you next time.