Hello, dear readers! So, last time we dived into somewhat more complex hierarchy layouts, so today we're looking at something else: the histogram and pie layouts.
Warning: the post contains large images!
These layouts are quite different both from the hierarchy layouts and each other. The only reason why I'm looking at them together is because of the "common theme" of the probably most basic graphics you can get.
Anyway, less talking, more coding!
Here's the HTML:
<html>
    <head>
        <script src="http://d3js.org/d3.v3.min.js" charset="utf-8"></script>
        <script src="http://cdnjs.cloudflare.com/ajax/libs/Colors.js/1.2.3/colors.min.js"></script>
    </head>
    <body>
      <div id="histogram" style="width: 500; height: 800"></div>
      <svg id="pie"></svg>
      <script src="03-histogram.js"></script>
      <script src="03-pie.js"></script>
      <script>
        histogram();
        pie();
      </script>
    </body>
</html>
Nothing interesting here, except the use of Colors.js. I've only used it for pie though.
Histogram
function histogram(){
    var values = d3.range(500).map(d3.random.normal(4.0, 1.0));
    var div = d3.select('#histogram');
    var histogram = d3.layout.histogram()(values);
    window.histogram = histogram;
    div.selectAll('div')
        .data(histogram)
        .enter().append('div').classed('bin', true)
        .style('position', 'absolute')
        .style('left', function(d){ return 10 + d.x * 50; })
        .style('width', function(d){ return d.dx * 50; })
        .style('top', function(d) { return 800 - d.y * 5; })
        .style('height', function(d){ return d.y * 5 })
        .style('background-color', 'blue')
        .style('border', '1px solid black');
}
Please ignore the function wrapper. In my last tutorial, I've explained the reason I use it.
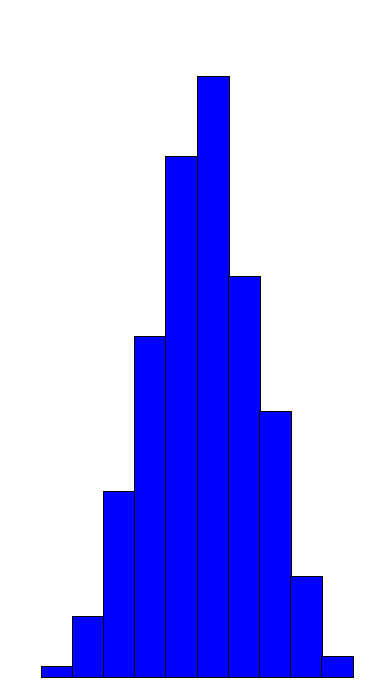
The first line is when we set our data. Basically, it's just giving us 500 normally distributed random numbers. This way, we can get the famous bell shape.
Then, after fetching the div and initializing the layout, it's basically it. We bind the absolute-positioned divs to the bins similar to how we created the areas for the treemap/partition layouts. All the other stuff is just sugar-coating the graph for prettier looks.
This is what we get afterwards (please keep in mind that the numbers are random, so you'll get slightly different results):
Pie
First thing's first, a disclaimer.
I've took most of the code for this example from here. I mostly just took that example and simplified it to the bare minimum.
So, in the tree and cluster layouts the links are, basically, the objects ready to be fed into the diagonal generator that would give us pretty bezier curves. Naturally, I haven't shown it in the tutorial itself in order not to clutter it with helper methods. Pie is similar in that respect: its objects are ready to be fed into the arc generator.
Here's the code:
// Inspired by https://square.github.io/intro-to-d3/examples/#a-pie-chart
function pie(){
    var svg = d3.select('#pie').attr('width', 500).attr('height', 500);
    var data = [1, 2, 3, 4, 5];
    var d3pie = d3.layout.pie();
    var pie = d3pie(data);
    window.pie = pie;

    //The arc generator
    var arc = d3.svg.arc().innerRadius(100).outerRadius(200);

    var g = svg.append('g').attr('transform', 'translate(250,250)');
    g.selectAll('path.slice').data(pie).enter()
        .append('path').classed('slice', true).attr('d', arc)
        .attr('fill', function(d){ return $c.rgb2hex(255 - 40 * d.value, 100, 40 * d.value); });
};
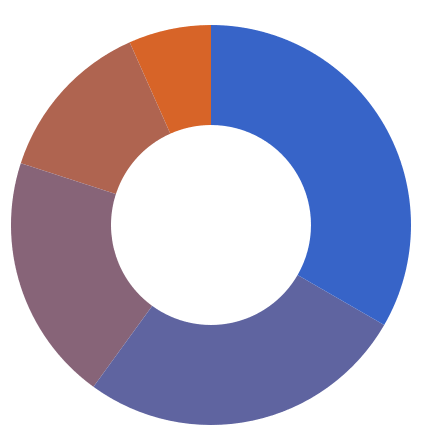
I honestly don't know if there's anything worth commending here. We get our data, feed it into the pie layout and bind the results to the path elements with arc generators as the path "description" attribute.
Here's what we get:
So, here are the histogram and pie layouts for you! Thanks for the reading and hope you enjoyed!
Thank you Dashing D3.js for giving me Twitter publicity and including my last tutorial to your newsletter!
And thank you everyone who retweeted, upvoted and wrote a reply!